
According to the Internal Revenue Service, more than 42 million Americans owe a total of $1.1 trillion in student debt. A recent initiative by mappingstudentdebt.org has looked at the numbers from across the country and programmed them into an interactive map.
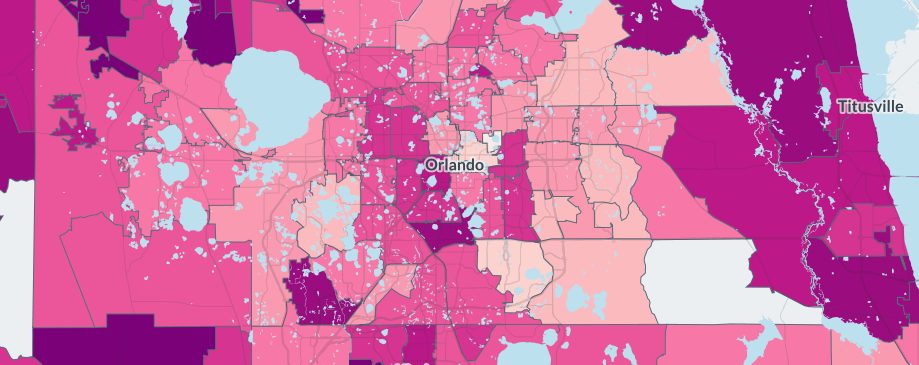
The maps show how borrowing for college occurs across the country, creating a mosaic of income inequality. The data is pulled from tax returns filed with the IRS, compared with zip code-level data on average household student loan balances.
The map reveals at least three trending key issues:
- rich zip codes that have high average student loan balances per household
- high delinquency afflicting low-income zip codes
- difference in loan balance geography versus geography of delinquencies
To see the map, click HERE.