
UPDATE: This map tool is not to show COVID-19 predictions or cases, but rather it shares data on what populations are most at-risk for infections based on pre-existing conditions shared via census data.
The New Mexico-based data-crunching wizards at RS21 (Website) have just launched a new data analytics website to help visualize at-risk populations and to support public health initiatives respond more effectively using an interactive map.
The Urban Health Vulnerability Index helps local governments and health planners to identify urban populations that are at high risk for COVID-19, including older adults and people with serious medical conditions like heart disease, diabetes, and lung disease based on Census data.
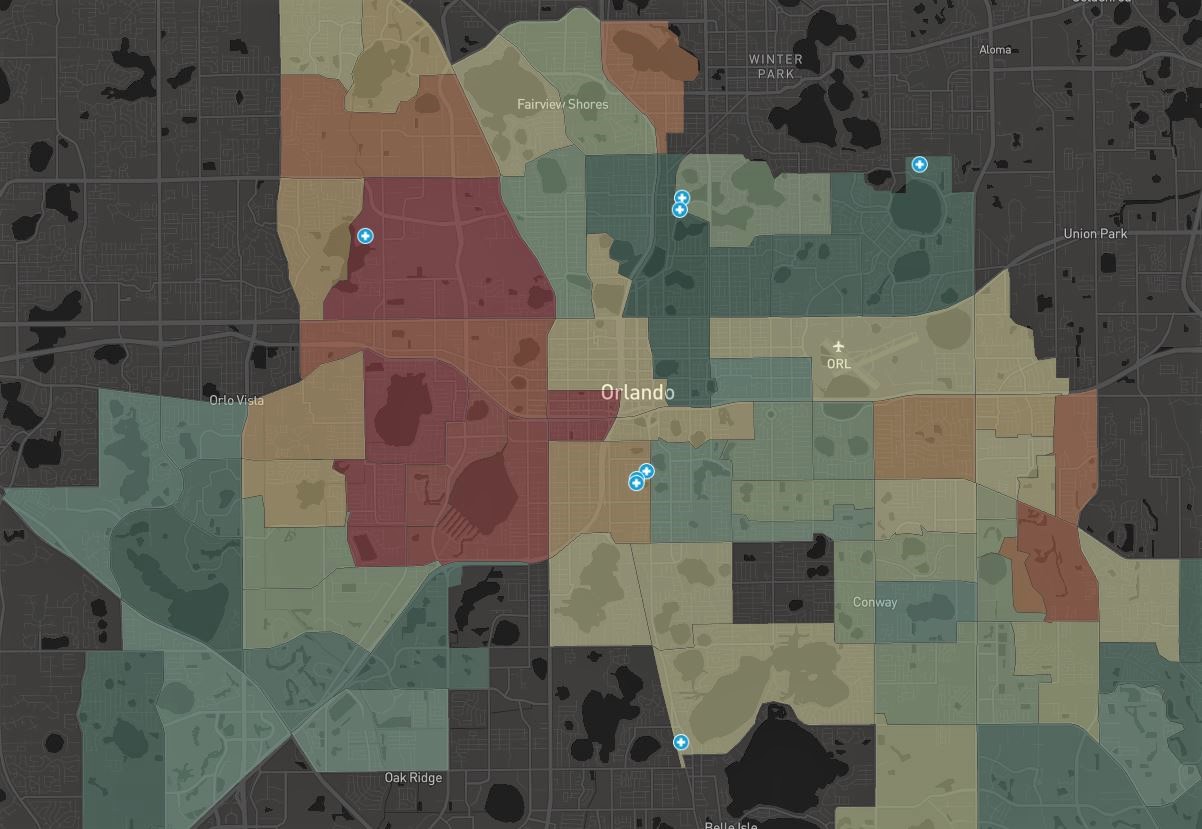
The results for Orlando show areas of concern in West Orlando and some parts of the Curry Ford/Goldenrod neighborhoods as well. Click HERE to use the map.